How to calculate time on page

Nov 26, 2024

Understanding how users spend their time on your site helps you understand your site’s strengths and weaknesses. Calculating the time spent on a page is the key metric for doing this. In this tutorial, we show you how to calculate time on page and related metrics using PostHog.

With the development of web analytics, we began autocapturing more properties like $prev_pageview_duration and $prev_pageview_pathname that make calculating this a lot easier.

Calculating average time on page

The easiest way to calculate average time on page is to create a new trend insight, aggregate by average property value, and select Previous pageview duration. In the visualization below, change the y-axis unit to Duration (s) and you get a graph of the average time on page over time.
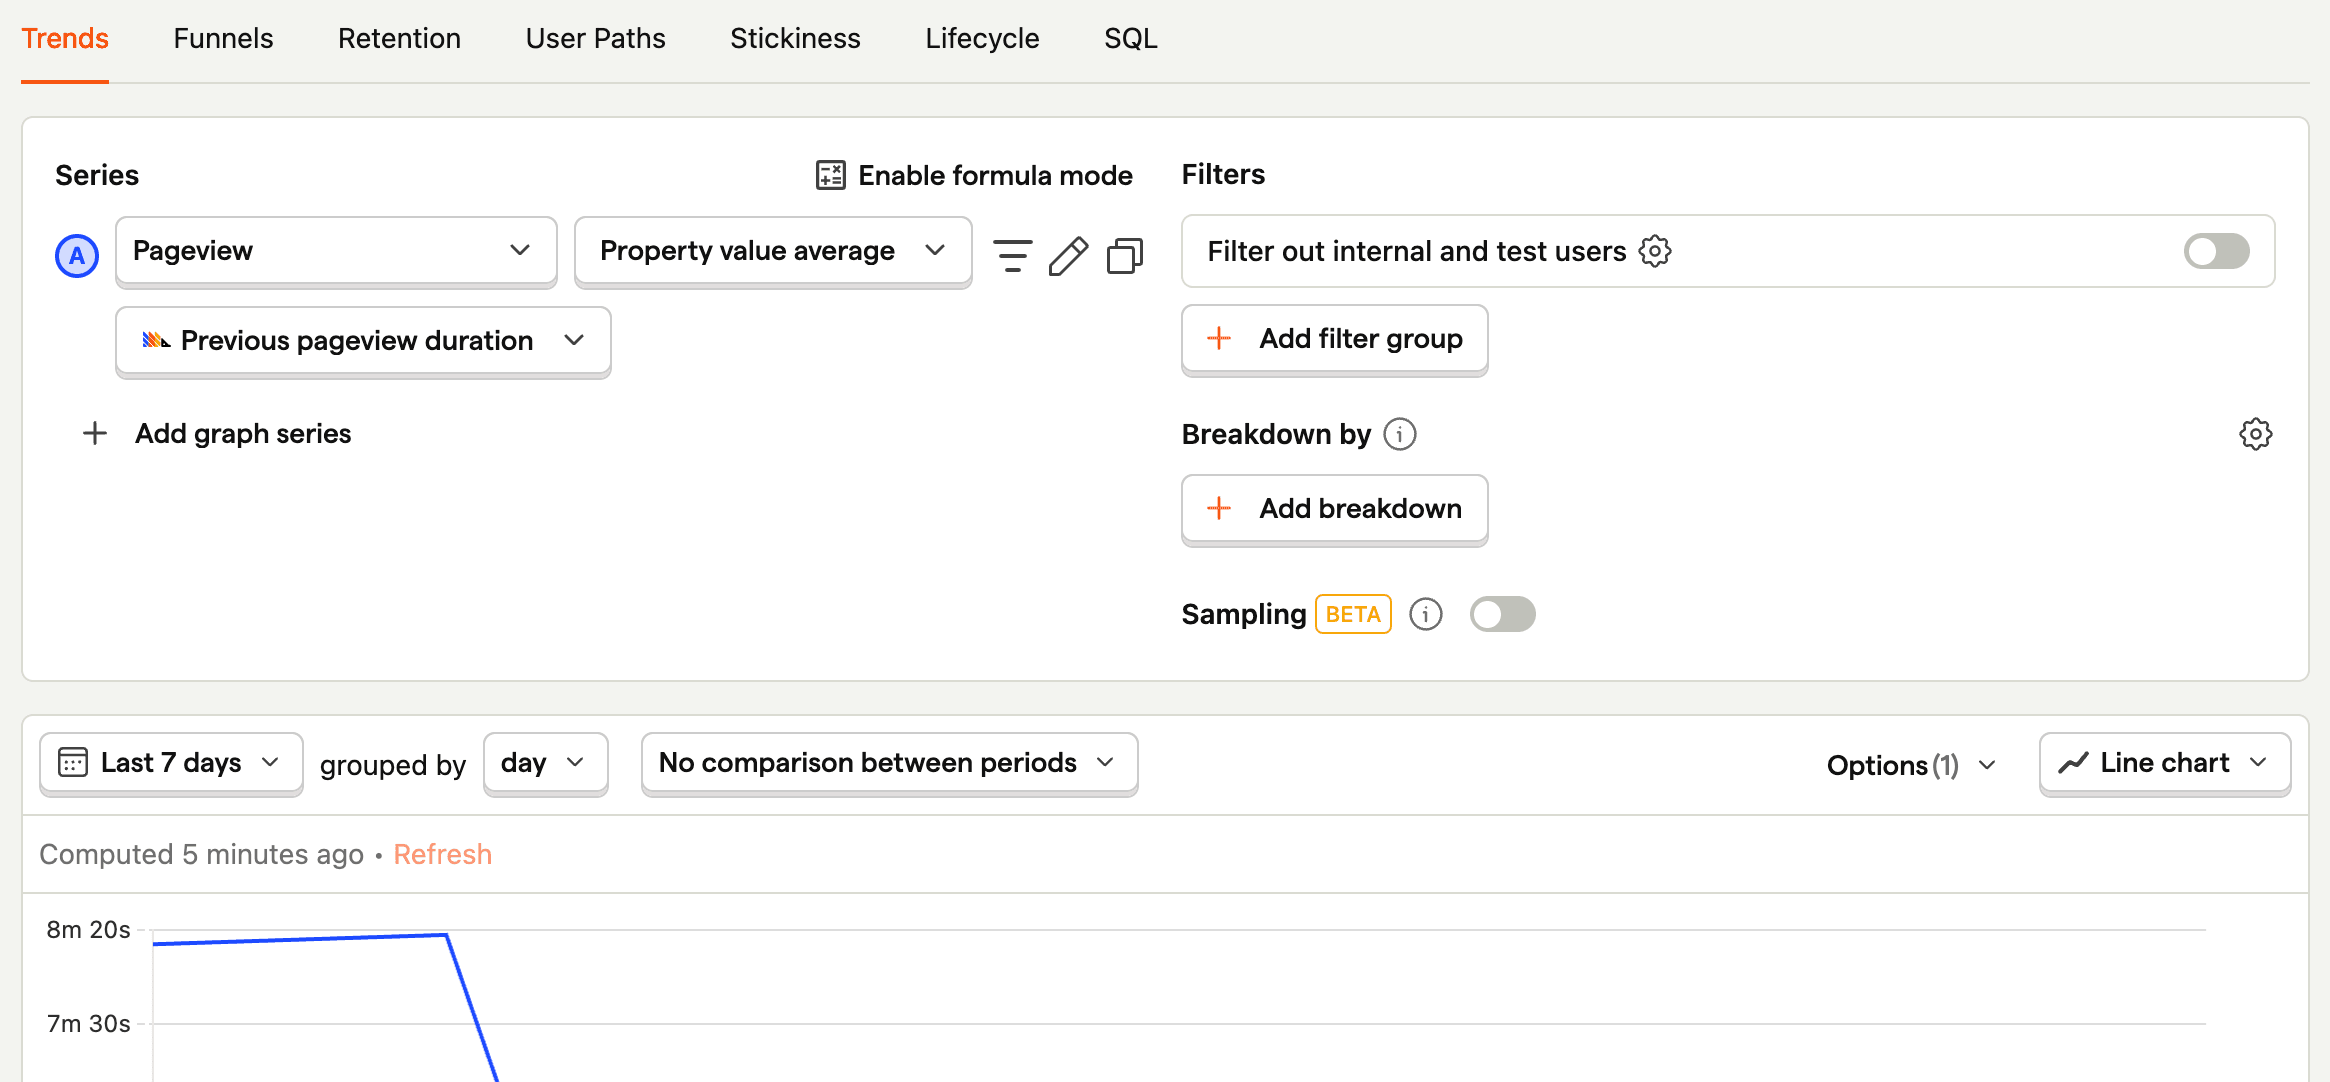
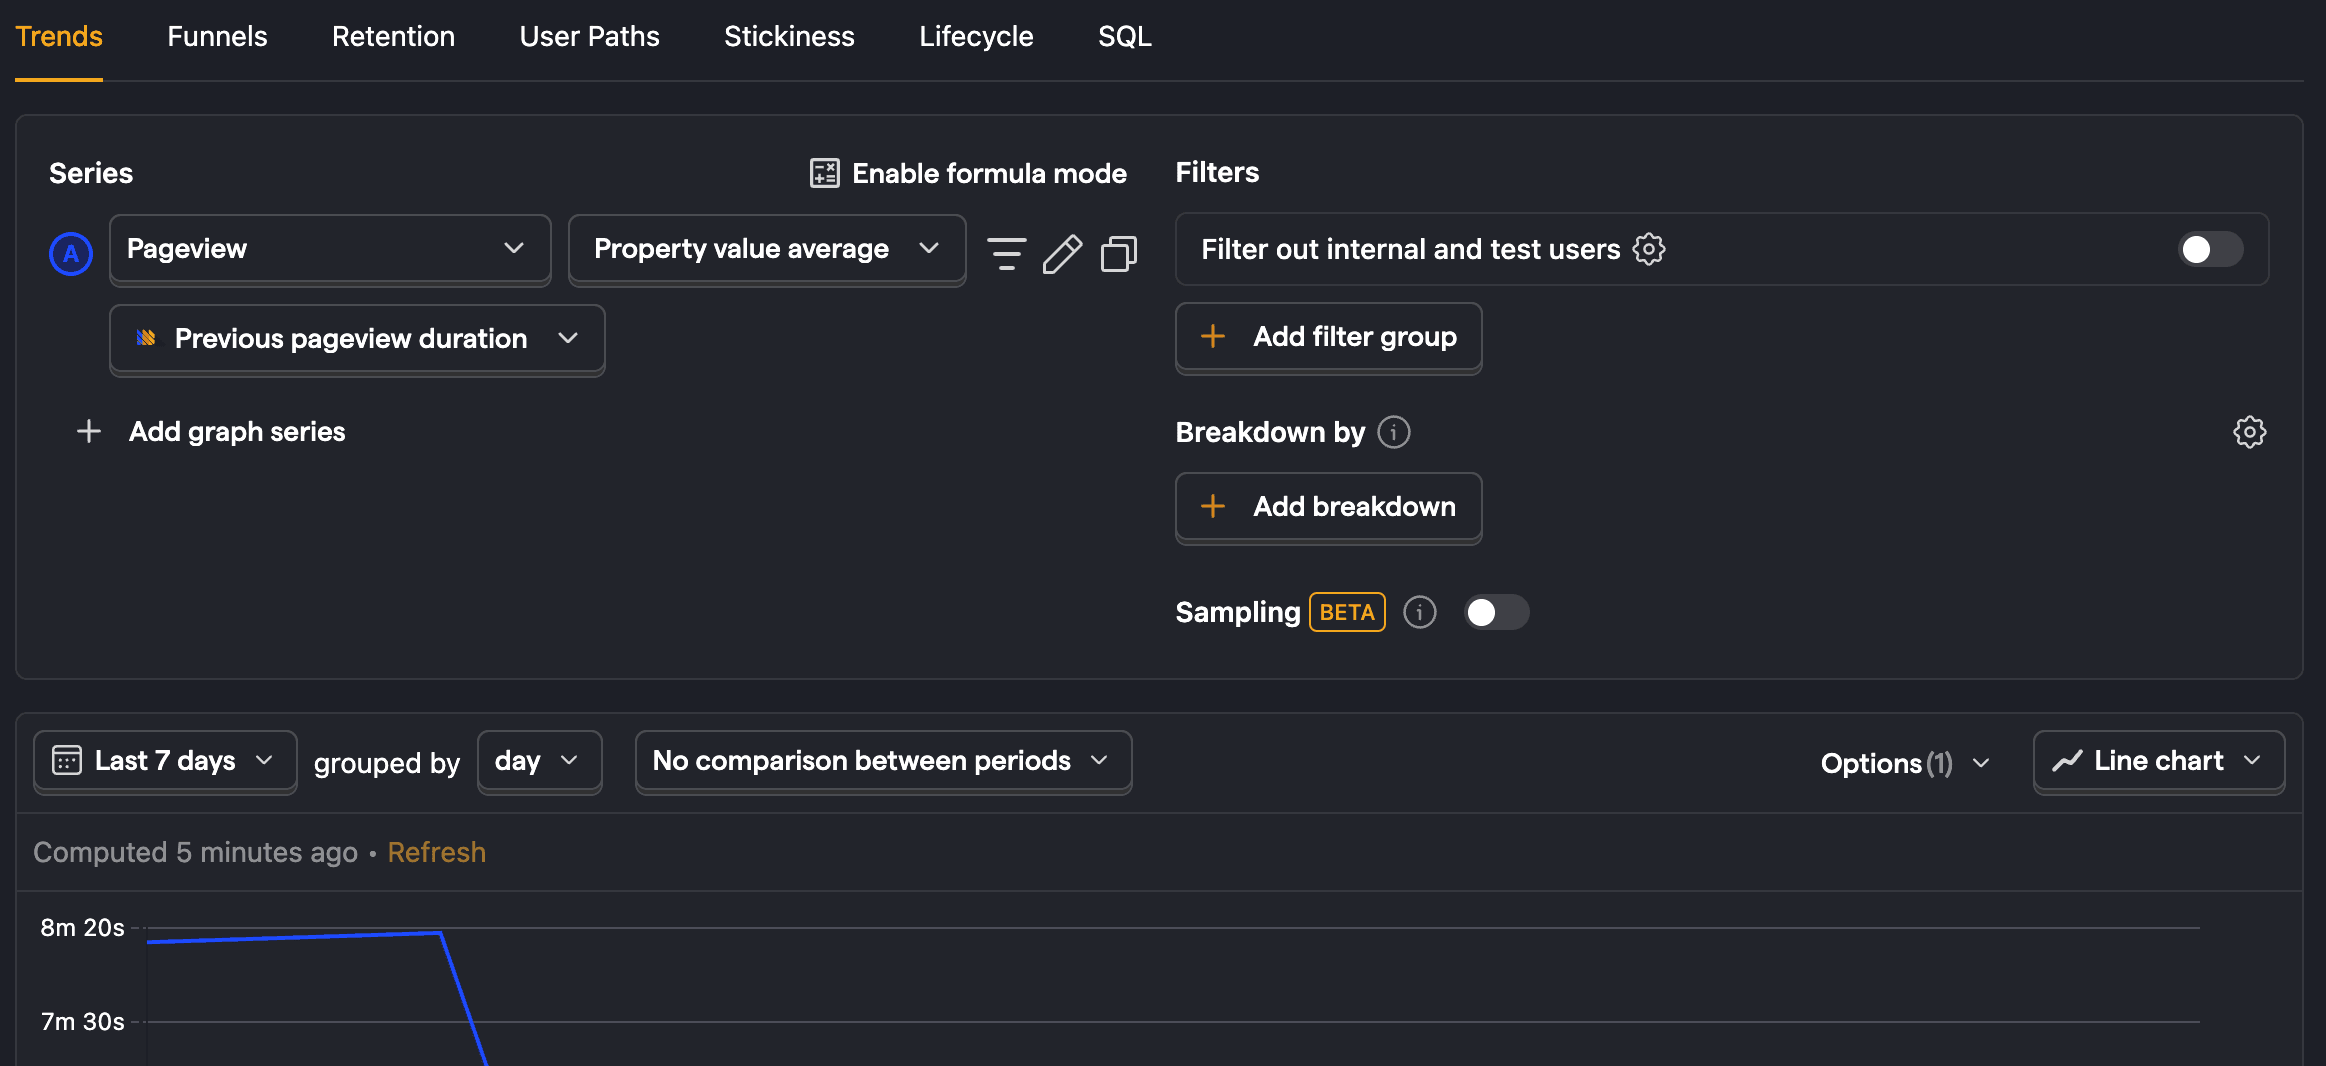
Average time on page trend

Calculating time on page for specific pages

To get the average time on page for specific pages, we can start by breaking down our time on page by the pathname. On the same insight, click Add breakdown and select Previous pageview pathname.
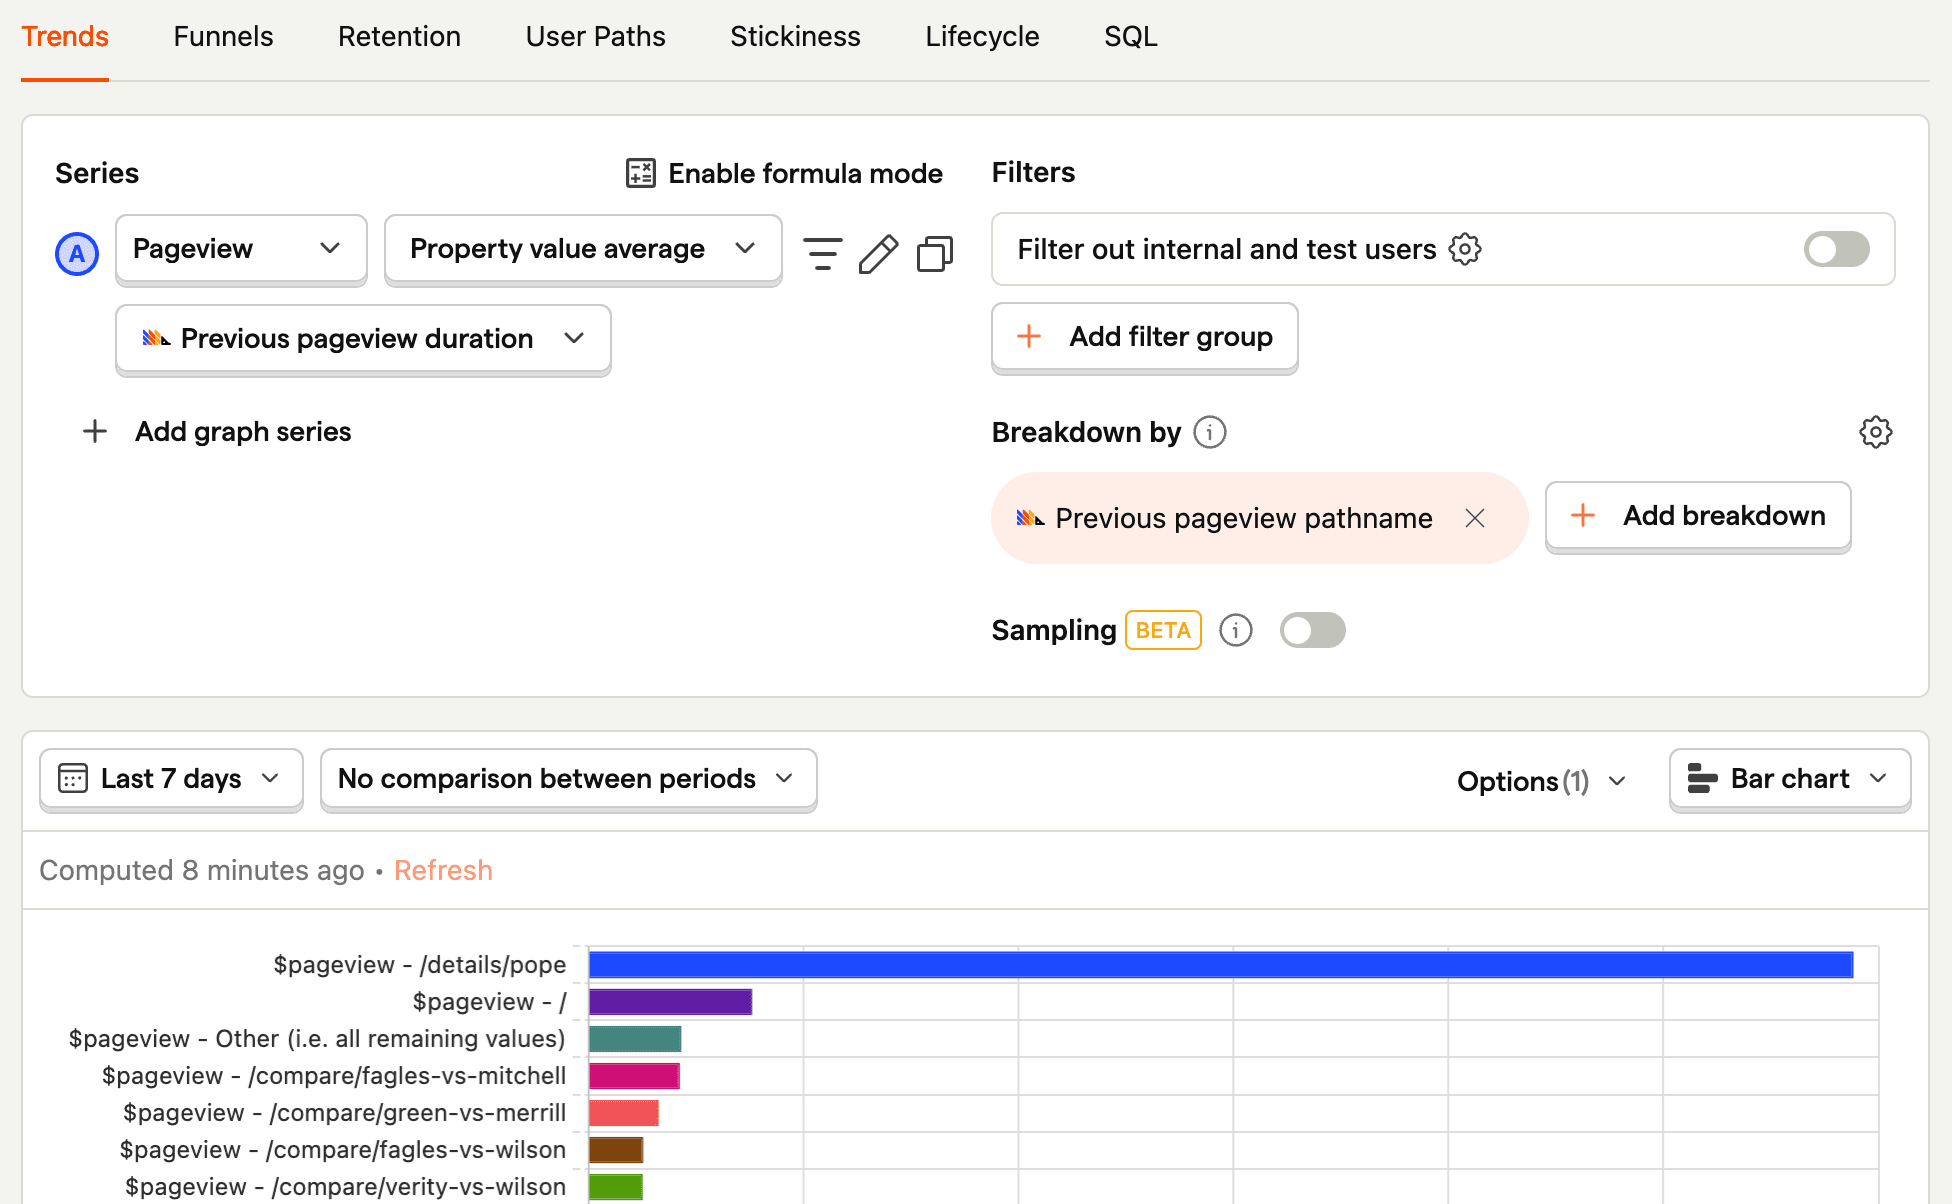
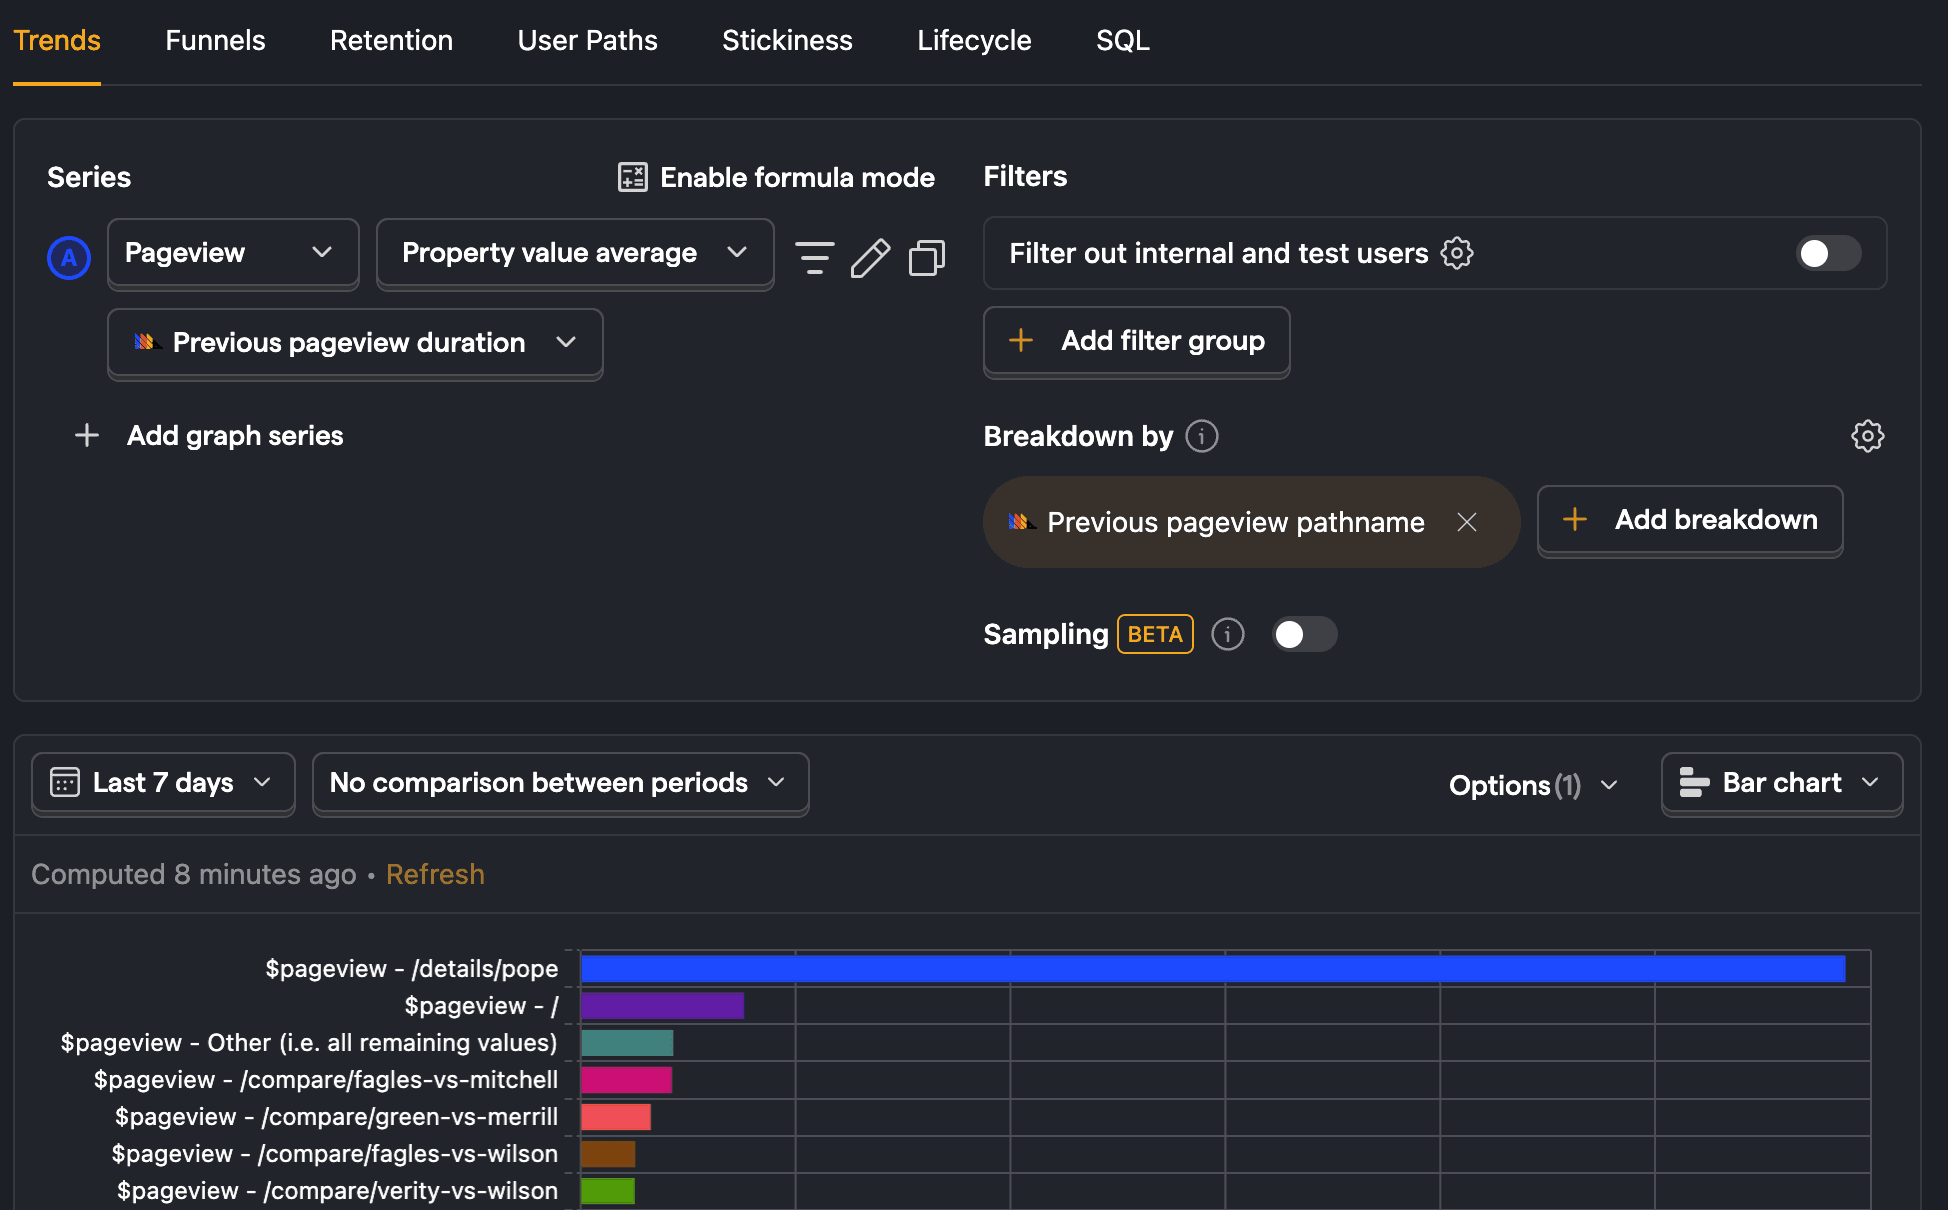
Average time on page breakdown

Doing this for your whole site might show many outliers. To limit this, you can add filters for previous pageview pathname or duration. This is also how you narrow in on a specific page to get its trend. For example, to get the average time on page for the homepage, remove the breakdown, and add a filter where Previous pageview pathname equals /.
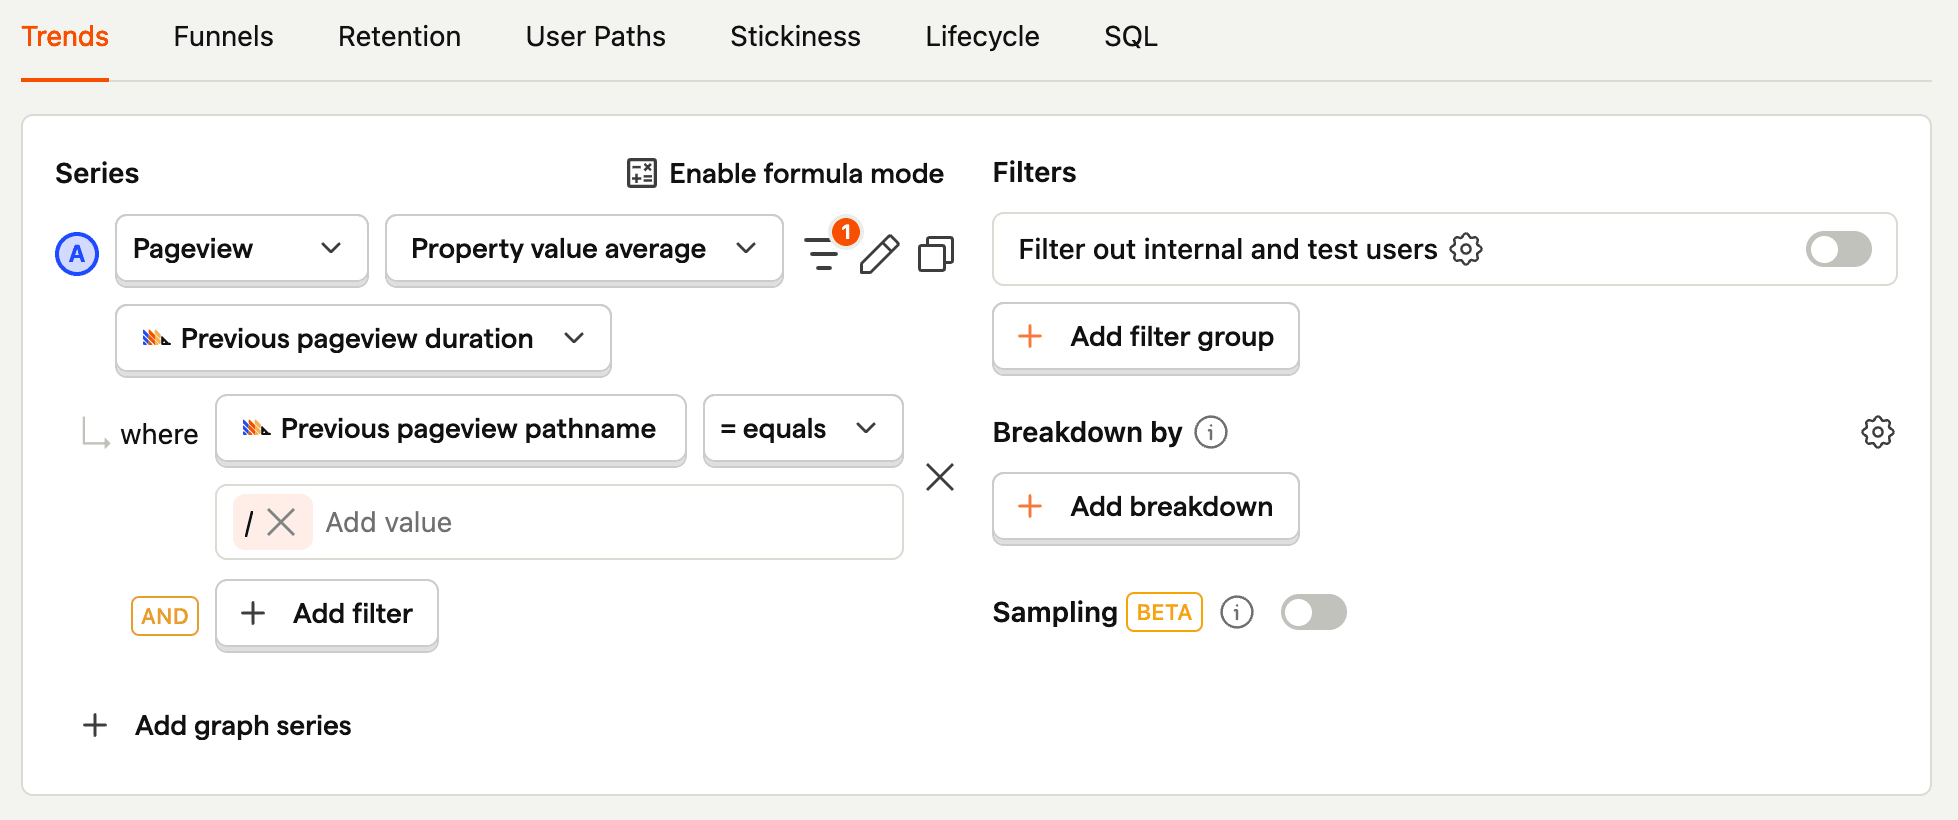
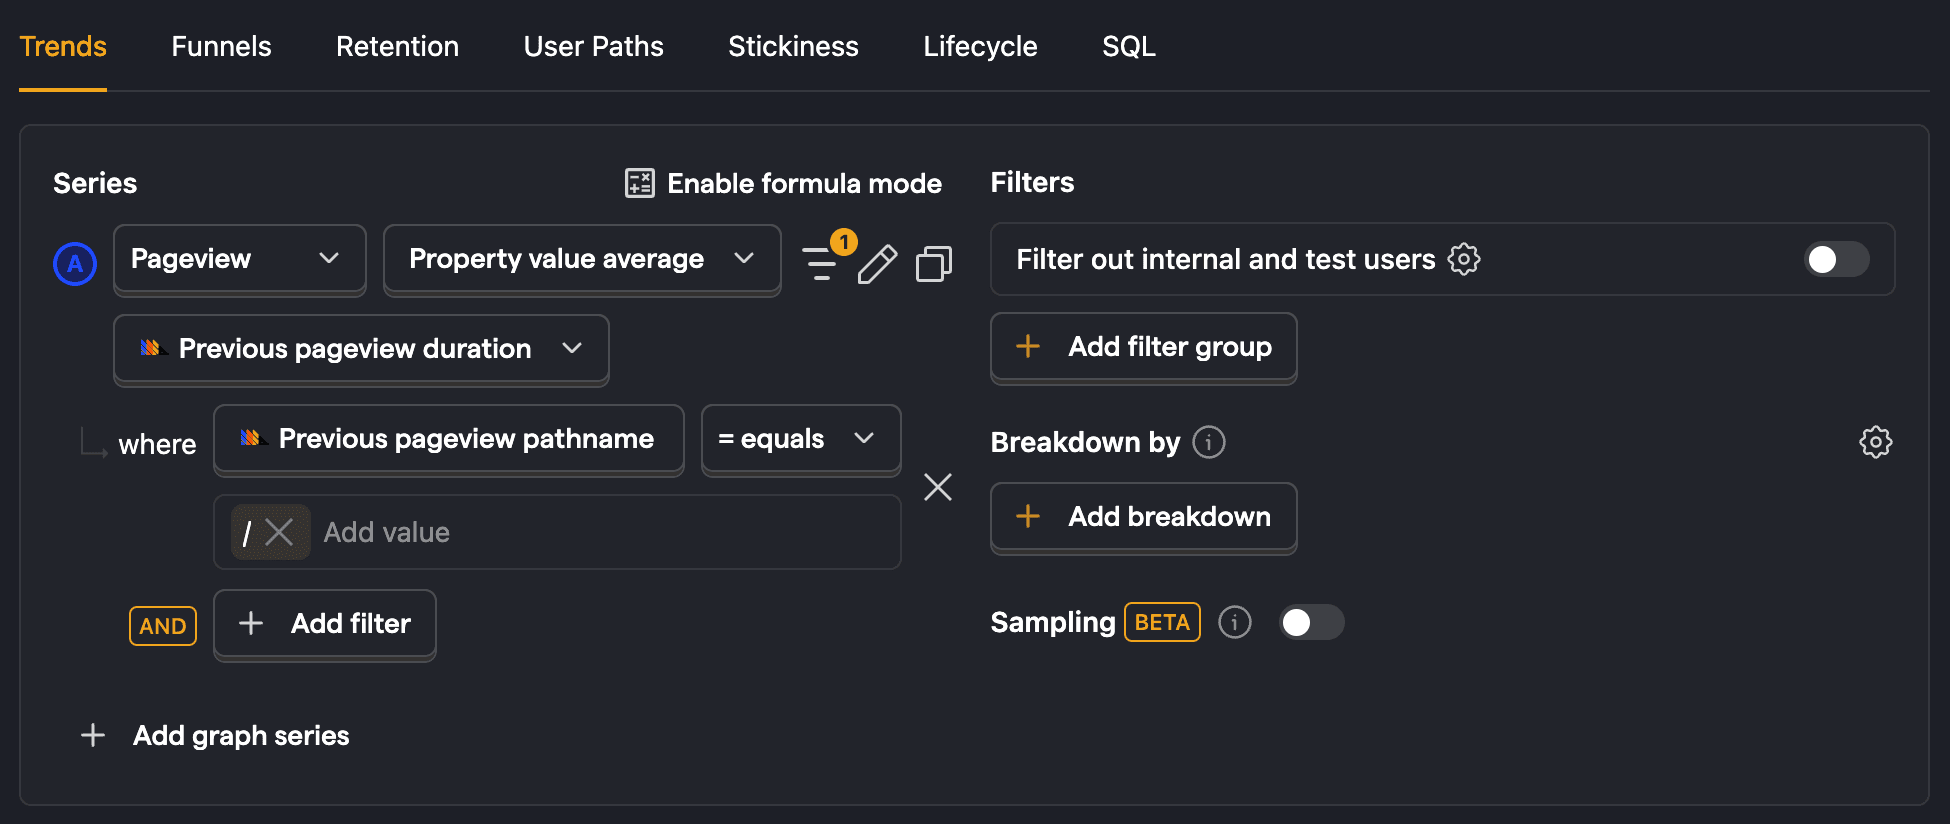
Average time on page filter

Note: Although we use $current_url or $pathname in many other places, you do not want to use it with $prev_pageview_duration. This would show the value for the current page alongside the time on page for the previous page which is misleading.

Diving deeper into time on page with SQL

Both the $prev_pageview_duration and $prev_pageview_pathname properties are available on events in the events table. This means we can use them in SQL queries like this:

SQL
select
avg(toInt(properties.$prev_pageview_duration)),
properties.$prev_pageview_pathname
from events
where properties.$prev_pageview_pathname is not null
and timestamp > now() - interval 1 day and timestamp < now()
group by 2
order by 1 desc

Using SQL window functions

If you don't have the $prev_pageview_duration property, you can still calculate time on page. This requires:

  1. Getting $pageview and $pageleave events.
  2. Using a WINDOW function to get the next $pageview or $pageleave event after the initial $pageview event.
  3. Using a dateDiff function to get the difference between the initial timestamp and the subsequent event’s timestamp as the time on page for each pageview.
  4. Average the time on page for all the pageviews.

Altogether, this looks like this:

SQL
SELECT avg(time_on_page) AS avg_time_on_page
FROM (
SELECT
dateDiff('minute', first_timestamp, next_timestamp) AS time_on_page
FROM (
SELECT
distinct_id,
event AS first_event,
timestamp AS first_timestamp,
first_value(event) OVER w AS next_event,
first_value(timestamp) OVER w AS next_timestamp
FROM events
WHERE
timestamp > toDateTime('2024-01-01 00:00:00')
AND (event = '$pageview' OR event = '$pageleave')
WINDOW w AS (PARTITION BY distinct_id ORDER BY timestamp ASC ROWS BETWEEN 1 FOLLOWING AND 1 FOLLOWING)
ORDER BY distinct_id, timestamp
) AS subquery
WHERE first_event = '$pageview'
AND (next_event = '$pageleave' OR next_event = '$pageview')
)

After running this query, you might notice that the result is very high. Industry averages range from 40 to 80 seconds, not the 180 minutes I got from PostHog’s data. This is because it includes situations where the subsequent event is months afterward.
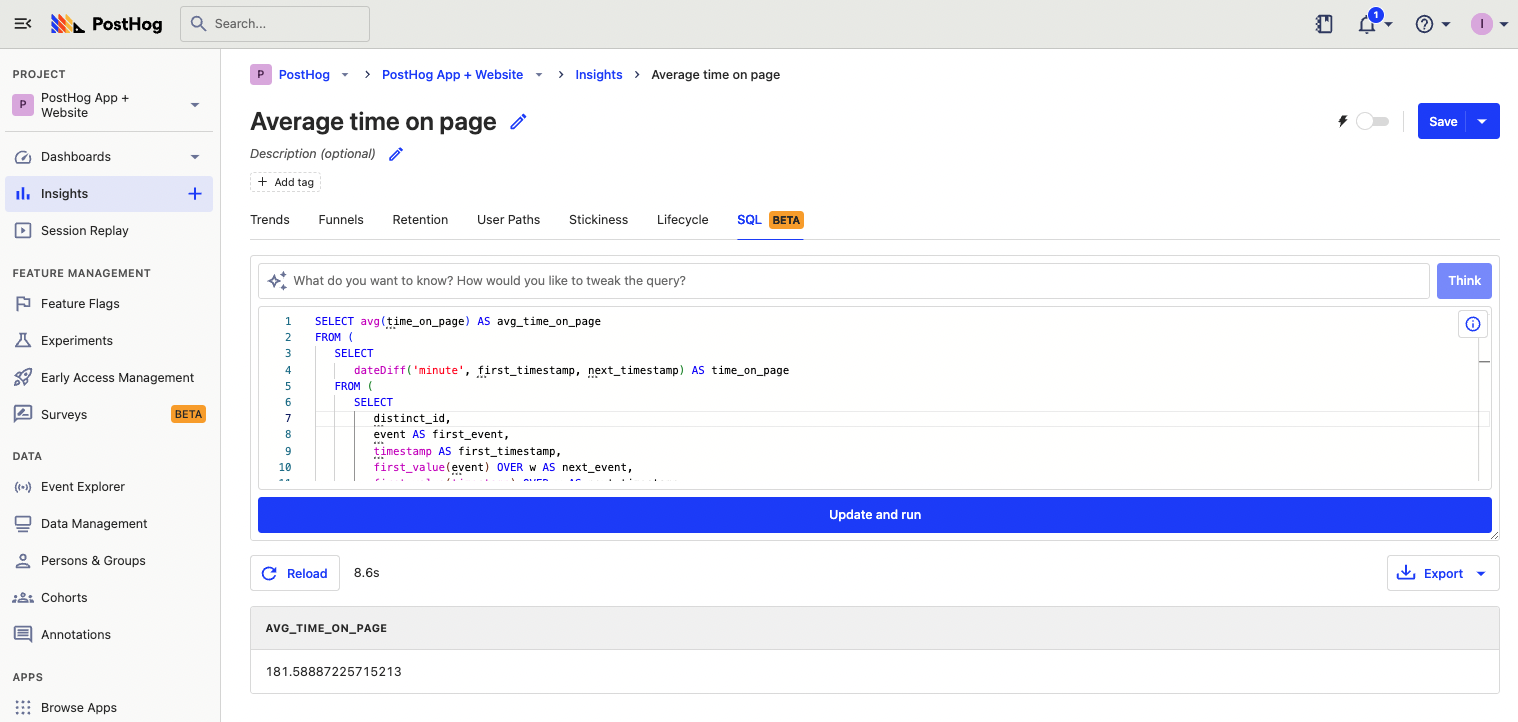
Average time on page

We can limit this by filtering out time_on_page values that are greater than 30 minutes. These are likely inactive and separate sessions. Both PostHog and Google Analytics count a 30 minute gap as inactivity.

SQL
SELECT avg(time_on_page) AS avg_time_on_page
FROM (
SELECT
dateDiff('minute', first_timestamp, next_timestamp) AS time_on_page
FROM (
SELECT
distinct_id,
event AS first_event,
timestamp AS first_timestamp,
first_value(event) OVER w AS next_event,
first_value(timestamp) OVER w AS next_timestamp
FROM events
WHERE
timestamp > toDateTime('2023-01-01 00:00:00')
AND (event = '$pageview' OR event = '$pageleave')
WINDOW w AS (PARTITION BY distinct_id ORDER BY timestamp ASC ROWS BETWEEN 1 FOLLOWING AND 1 FOLLOWING)
ORDER BY distinct_id, timestamp
) AS subquery
WHERE first_event = '$pageview'
AND (next_event = '$pageleave' OR next_event = '$pageview')
AND time_on_page <= 30 /* new */
)

This gives us a reasonable value for the average time on page.

Calculating time on page for specific pages

We can use the same SQL window function method to get the average time on page for different pages on our site.

To do this, we select the properties.$current_url for our events, group by that value, and sort avg_time_on_page from largest to smallest.

SQL
SELECT
avg(time_on_page) AS avg_time_on_page,
current_url /* new */
FROM (
SELECT
dateDiff('minute', first_timestamp, next_timestamp) AS time_on_page,
current_url /* new */
FROM (
SELECT
distinct_id,
event AS first_event,
timestamp AS first_timestamp,
first_value(event) OVER w AS next_event,
first_value(timestamp) OVER w AS next_timestamp,
properties.$current_url as current_url /* new */
FROM events
WHERE
timestamp > toDateTime('2023-01-01 00:00:00')
AND (event = '$pageview' OR event = '$pageleave')
WINDOW w AS (PARTITION BY distinct_id ORDER BY timestamp ASC ROWS BETWEEN 1 FOLLOWING AND 1 FOLLOWING)
ORDER BY distinct_id, timestamp
) AS subquery
WHERE first_event = '$pageview'
AND (next_event = '$pageleave' OR next_event = '$pageview')
AND time_on_page <= 30
)
GROUP BY current_url /* new */
ORDER BY avg_time_on_page DESC /* new */

If you have a high-traffic site with many unique URLs, you might have many unique pages with 30 minute average time_on_page values at the top of your list. To limit this and get more useful information, you can filter for pageview events from specific sections of your site.

For example, to get the time on site for blog pages we can add another filter for properties.$current_url LIKE '%posthog.com/blog%'.

SQL
SELECT
avg(time_on_page) AS avg_time_on_page,
current_url
FROM (
SELECT
dateDiff('minute', first_timestamp, next_timestamp) AS time_on_page,
current_url
FROM (
SELECT
distinct_id,
event AS first_event,
timestamp AS first_timestamp,
first_value(event) OVER w AS next_event,
first_value(timestamp) OVER w AS next_timestamp,
properties.$current_url as current_url
FROM events
WHERE
timestamp > toDateTime('2023-01-01 00:00:00')
AND (event = '$pageview' OR event = '$pageleave')
AND properties.$current_url LIKE '%posthog.com/blog%' /* new */
WINDOW w AS (PARTITION BY distinct_id ORDER BY timestamp ASC ROWS BETWEEN 1 FOLLOWING AND 1 FOLLOWING)
ORDER BY distinct_id, timestamp
) AS subquery
WHERE first_event = '$pageview'
AND (next_event = '$pageleave' OR next_event = '$pageview')
AND time_on_page <= 30
)
GROUP BY current_url
ORDER BY avg_time_on_page DESC

One last thing you might want to filter out is URLs with question marks or number signs. To do this add the statements AND properties.$current_url NOT LIKE '%?%' and AND properties.$current_url NOT LIKE '%#%' below the properties.$current_url LIKE '%posthog.com/blog%' filter. This cleans the URLs.
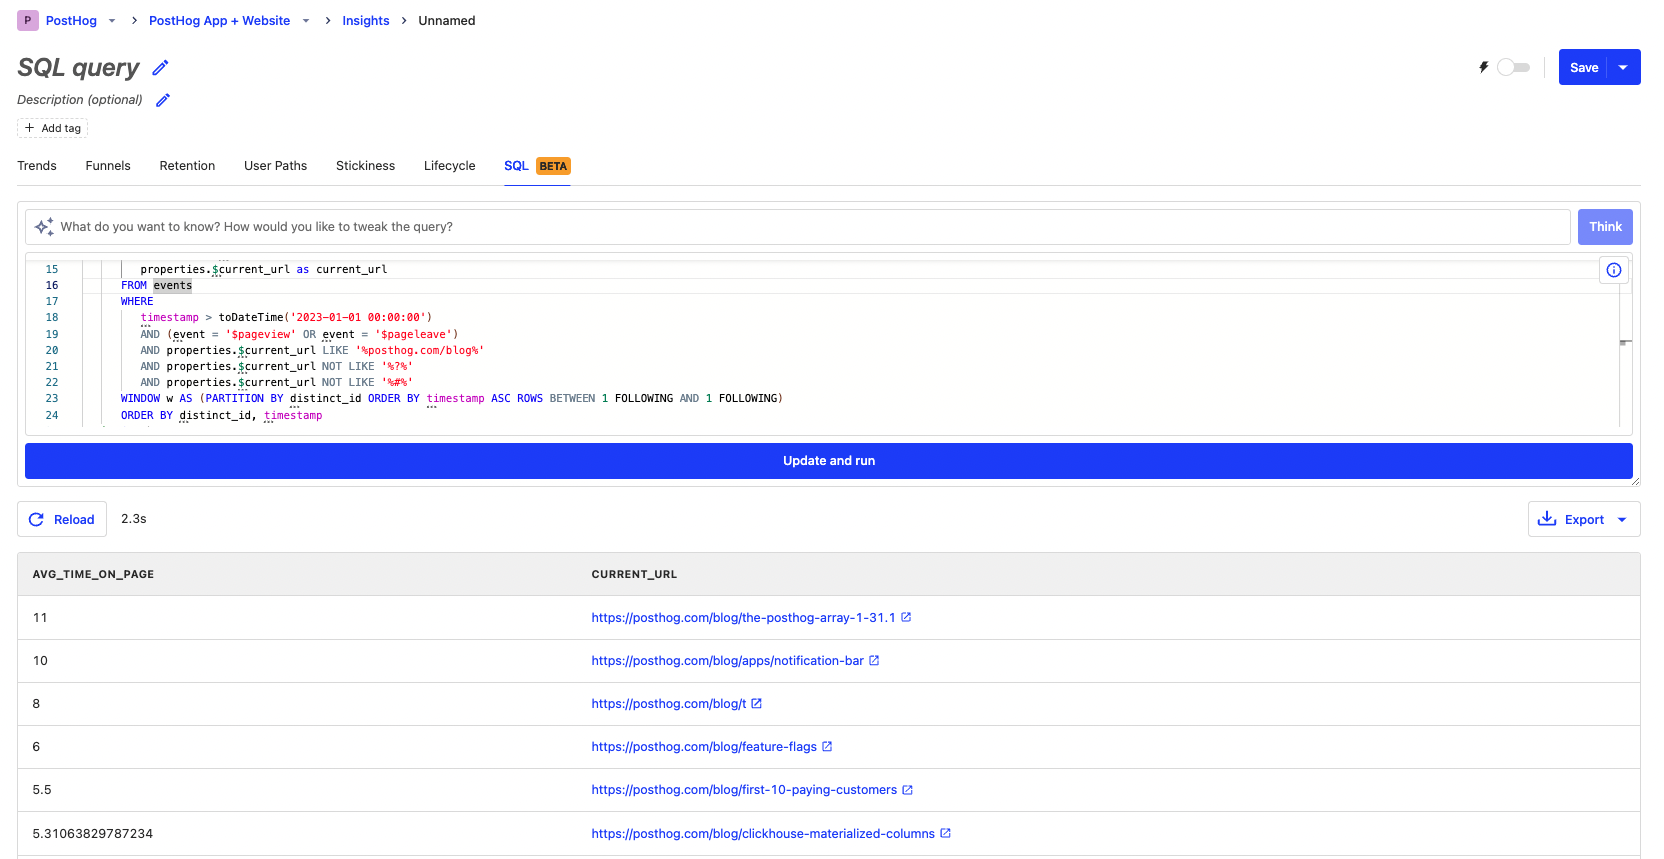
URLs

Time on page for an individual page

We can get the time on page for an individual page by filtering for events where the properties.$current_url equals the page you’re interested in. For example, to get the time on page for our session metrics tutorial, we can filter for events where properties.$current_url = 'https://posthog.com/tutorials/session-metrics'.

SQL
SELECT
avg(time_on_page) AS avg_time_on_page
FROM (
SELECT
dateDiff('minute', first_timestamp, next_timestamp) AS time_on_page
FROM (
SELECT
distinct_id,
event AS first_event,
timestamp AS first_timestamp,
first_value(event) OVER w AS next_event,
first_value(timestamp) OVER w AS next_timestamp,
properties.$current_url as current_url
FROM events
WHERE
timestamp > toDateTime('2023-01-01 00:00:00')
AND (event = '$pageview' OR event = '$pageleave')
AND properties.$current_url = 'https://posthog.com/tutorials/session-metrics' /* new */
WINDOW w AS (PARTITION BY distinct_id ORDER BY timestamp ASC ROWS BETWEEN 1 FOLLOWING AND 1 FOLLOWING)
ORDER BY distinct_id, timestamp
) AS subquery
WHERE first_event = '$pageview'
AND (next_event = '$pageleave' OR next_event = '$pageview')
AND time_on_page <= 30
)
ORDER BY avg_time_on_page DESC

If you want to see a list of events and user distinct IDs that make up that value, you can remove the average time on page calculation, show distinct IDs, and sort by time_on_page.

SQL
SELECT
dateDiff('minute', first_timestamp, next_timestamp) AS time_on_page,
distinct_id
FROM (
SELECT
distinct_id,
event AS first_event,
timestamp AS first_timestamp,
first_value(event) OVER w AS next_event,
first_value(timestamp) OVER w AS next_timestamp
FROM events
WHERE
timestamp > toDateTime('2023-01-01 00:00:00')
AND (event = '$pageview' OR event = '$pageleave')
AND properties.$current_url = 'https://posthog.com/tutorials/session-metrics'
WINDOW w AS (PARTITION BY distinct_id ORDER BY timestamp ASC ROWS BETWEEN 1 FOLLOWING AND 1 FOLLOWING)
ORDER BY distinct_id, timestamp
) AS subquery
WHERE first_event = '$pageview'
AND (next_event = '$pageleave' OR next_event = '$pageview')
AND time_on_page <= 30
ORDER BY time_on_page DESC

Further reading

Subscribe to our newsletter

Product for Engineers

Read by 25,000+ founders and builders.

We'll share your email with Substack

Questions? Ask Max AI.

It's easier than reading through 552 docs articles.

Comments